From Stars to Planets: Births and Deaths on Cosmic Scale

Planetary system development (artist’s impression)

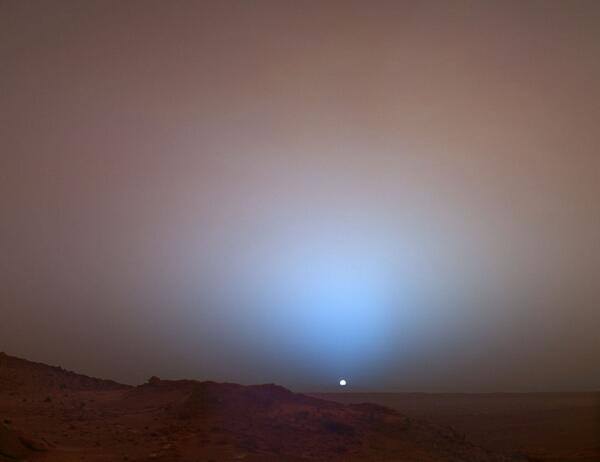
Moving along on our world building quest, I’ll start talking about planets and gradually moving towards terrestrial planets and their properties.

Planet habitability depends on several factors: galactic environment of the planetary system (which includes the abundance of metals), stability of the planetary system, evolution, age and activity of the star (or stars), atmosphere, magnetosphere, and distance of a planet from its star. All this can make habitable worlds extremely rare. But we don’t take “no” for an answer, right?

Planetary system formation

A good (if not the best) example of planetary system formation and evolution is our own Solar System.

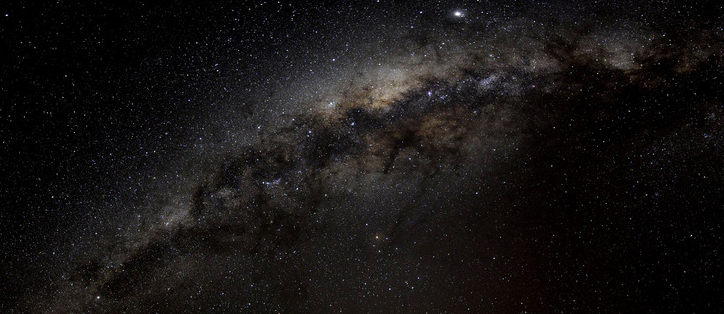
Stars form from clouds of gas, dust and ices. When a cloud of interstellar matter crosses the spiral arm of a galaxy, it begins to form clumps. The gravitational forces within the clumps cause them to contract, forming protostars. The center of a protostar may reach a temperature of several millions of degrees Celsius. At this high temperature, a fusion reaction begins. The energy released by this reaction prevents the protostar from contraction. According to the most conservative estimates it could take a hundred million years for a new sun to form (Montmerle et al. 2006).

Planetary system formation coincides with the process of star formation, when a protoplanetary disc is formed around a young stellar object. Mass and metallicity of the star and protoplanetary disc impacts the type and size of planetary systems they might possess.

Hubble image of protoplanetary discs in the Orion Nebula, a light-years-wide “stellar nursery” probably very similar to the primordial nebula from which our Sun formed

For a start to possess terrestrial planes it would have to have formed from a nebula containing sufficient heavy elements. The star would have to be Population I and younger than the age of formation of the galactic disc (~10 Gyr). Over this period, the metallicity of the interstellar medium has risen due to the products of nucleosynthesis from successive generations of stars.

Naturally, one might expect maximum mass condensation within the pre-planetary nebula to vary with stellar luminosity. The central density of nebular dust, the parameter from which the mass of the nebula is scaled, varies in direct proportion to the mass and metallicity of the central star (Fogg, 1992). Formulas for the radius and density of nebular dust (the size of the protoplanetary disc and possible planetary system scale) can be taken from the same paper. The ACCRETE algorithm, mentioned in it, can be taken here. The best option from that list is the Starform program (written in C) by Matt Burdick, 1988, which is an enhancement of the basic accretion code with more output options.

Planet formation incorporates four distinct stages (Lissauer, 1993).

At the initial stage grains condense and grow in the hot nebular disk, gradually settling to the mid-plane. The composition of the grains is determined by the local temperature of the nebula.

Then, during the early stage growth of grains to km-sized planetesimals occurs. Planetesimals initially have low eccentricities (e) and inclinations (i) due to gas drag.

At the middle stage (oligarchic growth) “focused merging” leads to agglomeration of planetesimals into Moon-to Mars-sized “planetary embryos.” Possible runaway accretion and subsequent dynamical friction (loss of momentum and kinetic energy of moving bodies through a gravitational interaction with surrounding matter in space) may lead to polarization of the mass distribution: a few large bodies with low e and i in a swarm of much smaller planetesimals with high e and i. The timescale for this process correlates inversely with heliocentric distance. Kokubo and Ida (2000) suggest that planetary embryos form in <1 Myr at 1 AU, in ∼ 40 Myr at 5 AU, and in > 300 Myr past 10 AU. The formation timescale and masses of planetary embryos are sensitive to the surface density of the disc.

During the late stage, once runaway accretion has terminated due to lack of slow moving material, planetary embryos and planetesimals gradually evolve into crossing orbits as a result of cumulative gravitational perturbations. This leads to radial mixing and giant impacts until only a few survivors remain, which are the nuclei of the system’s planets. The timescale for this process is approximately 10^8 yrs.

Planetary system development (artist’s impression)

Because of the higher temperatures in the inner stellar system, accretion of ice and gas is inhibited so the planetesimals grow into what is known as the rocky terrestrial planets. Planetary growth is slowed down significantly once a gap is cleared within its orbit.

But during their lifetimes planets continue to grow by small amounts as they sweep up micrometeor dust particles or are impacted every few million years by larger asteroids or comets.

Planetesimals that are modest in size but did not merge to form larger objects, become asteroids and comets. The close proximity of Jovian gravitational pull might result in prevention of planetesimals growing larger, as it happened in the Solar System, leading to formation of the asteroid belt.

The the formation of giant planets can also occur via the disk instability (also see the papers here, here, here and here). However, if a disc mass is too small, the ability of disk instability to produce viable, self-gravitating clumps is signficantly compromised. Thus, core accretion remains as the favored formation mechanism for giant planets in such lower mass disks.

March 9th 2012 Update – A new accretion model has been offered by Anne Hofmeister, PhD, research professor of earth and planetary sciences and Robert Criss, PhD, professor in earth and planetary sciences at Washington University in St.Louis.

Water content

The water content of planetesimals in a given planetary system depends in a complex way upon a range of factors including the mass and evolutionary characteristics of the protoplanetary disk, overall metallicity of the molecular cloud clump from which the star is forming, and the positions, masses and timings of formation of the system’s giant planets.

Chambers (2003) found that the water content of terrestrial planets depends strongly on the eccentricity, mass and formation time of the giant planets, with larger values of e and M leading to drier planets, while larger values of giants time formation time led to more volatile-rich planets. He also found that systems with lower mass giant planets form the most life-sustaining planets.

Another study shows as well that a Jovian planet of larger mass forms a smaller number of terrestrial planets than a lower-mass body, but the water content of the terrestrial planets does not vary significantly with “Jupiter” mass.

August 27th 2013 Update — New study sheds light on planets in the habitable zone of red dwarfs. More recent work refreshes the possibility of water on these distant worlds, previously expected to be dry.

A job for a Jupiter

The biggest giant of the planetary system is usually referred to as Jupiter (or a Jovian planet), giving credit the Jupiter of the Solar System.

It has been shown that an eccentric Jupiter preferentially ejects much of the water-rich material beyond 2.5 AU, which causes the terrestrial planets to be dry (Chambers and Cassen 2002, Raymond et al., 2004). It has also been shown that, for water-rich terrestrial planets to form in the habitable zone, a Jupiter-mass giant planet must be at least 3.5 AU from the star and much farther if its eccentricity is nonzero (Raymond 2006). A Jupiter-mass giant planet at 5 AU, even on a circular orbit, plays a negative role in the water delivery process, ejecting more water-rich material than it scatters inward (Raymond et al., 2005a).

Systems with eJ > 0 tend to form terrestrial planets with slightly higher eccentricities than those with eJ = 0, and the total mass in terrestrial planets is less for systems with eccentric Jupiters. During planetary formation an eccentric Jupiter clears out the asteroid region much more quickly than a low eccentricity Jupiter (eJ < 0.1), both by increased ejection efficiency and, more significantly, a large increase in the number of objects which collide with the Sun, as expected from the results of Chambers and Wetherill (2001). The result of this is that eccentric giant planets tend to form volatile-poor terrestrial planets (Raymond et al., 2004).

In our Solar system Jupiter also played a key role in the formation of other giants and is believed to be important to life on Earth. It helps to stabilize the orbits of the inner planets, which in turn helps to stabilize Earth’s climate. And it keeps the inner solar system relatively free of comets and asteroids that could cause devastating impacts.

However, if Jupiter was not in orbit around the Sun and Earth were the only planet orbiting our star, the eccentricity of its orbit would not vary over time. The Earth’s eccentricity varies primarily due to interactions with the gravitational fields of Jupiter and Saturn.

More recent simulations show that the frequent formation of planetary-mass objects in the disk suggests the possibility of constructing a hybrid planet formation scenario, where the rocky planets form later under the influence of the giant planets in the protoplanetary disk (Shu-ichiro Inutsuka et al. 2010).

The snow line

In astrophysics the term refers to a particular distance in the solar nebula from the central protosun where it is cool enough for hydrogen compounds such as water, ammonia, and methane to condense into solid ice grains. Depending on density, that temperature is estimated to be about 150K – 170K. A density increase immediately past the snow line is expected due to the “cold trap” effect (Stevenson and Lunine, 1988). Thus, the lower temperature in the nebula beyond the frost line makes many more solid grains available for accretion into planetesimals and eventually planets. The frost line therefore separates terrestrial planets from Jovian planets.

There is a large uncertainty in the position of the snow line in the solar nebula. The standard notion of a snow line around 4–5 AU can explain the rapid formation of Jupiter in a high density environment immediately past the snow line. However, volatile-rich classes of asteroids are found as close as 2–2.5 AU, and are presumably a fossil record of ice-bearing material. Models of protoplanetary disks around T Tauri stars by Sasselov and Lecar (2000) result in snow lines as close as 1 AU to the central stars, depending primarily on the stellar luminosity and the rate of accretional heating within the disk. As these quantities evolve with time, so might the position of the snow line migrate with time.

Currently, the snow line of our solar system is around 2.7 AU, near the middle of the asteroid belt.

Snow line calc formula: SL =2.7*(Mstar/Msun)^2

It is possible to have gas giants (or mini gas giants) inside the frost line. Close-in giant planets (e.g. “hot Jupiters”, “hot Saturns”, “hot Neptunes” and Wet Giants) are thought to form far from their host stars and migrate inward, through the terrestrial planet zone, via torques with a massive gaseous disk. Several-Earth-mass planets also form interior to the migrating Jovian planet, analogous to recently discovered “hot Earths”. Very-water-rich, Earth-mass planets form from surviving material outside the giant planet’s orbit, often in the habitable zone and with low orbital eccentricities (Raymond et al, 2006).

Metallicity

Higher metallicity means that (for a fixed total protoplanetary disc mass) the amount of solid material will be higher. The abundance of raw materials in a metal-rich protoplanetary disc increases the surface density and so accelerates the build-up of gas giant cores in the inner 10 AU. Pollack et al. (1996) found that increasing the surface density of solids by 50 per cent (equivalent to just +0.18 in [M/H]) reduced the time to form Jupiter from 8 to 2 Myr.

When substantial cores can form while the disc is still in its early gas-rich phase (~10 Myr), they can accumulate thick gaseous envelopes and also migrate inwards due to the viscous drag of the gas. This can produce inner gas giants as observed. The general effect of higher solid abundance is to speed up core growth, and so there is much more time for giant planets to form and migrate before the disc disappears.

While the occurrence of gas giant planets is a sensitive function of stellar metallicity, the occurrence of debris discs does not have this same dependence. This suggests that construction of smaller planetesimal bodies, such as those found in the Kuiper Belt, does not require enhanced metallicity. However, core growth times are much longer in the outer disc, at several tens of AU. If it can take 3 Gyr for a Pluto-sized core to form out at 100 AU (Kenyon & Bromley 2004), the gas would have disappeared much earlier and so the planet could not have added an atmosphere (Greaves 2005).

Planetary system death and (possible) “life after death”

It is generally believed that our Sun was created within a nebular cloud produced by a supernova nearly five billion years ago. However, planets, including Earth, may have been remnants ejected from the dying solar system by a supernova.

Using our own solar system as an example (Schroder & Smith 2008) when the parent star became a red giant, the accelerating power of its solar winds would have blown away the life-sustaining atmospheres of its planets which included airborne microbes, creating a nebular cloud at the far edges of the dying solar system.

The parent star may have lost between 40% to 80% of its mass before exploding (Kalirai, et al. 2007; Liebert et al. 2005; Wachter et al. 2008) and its planets would have significantly increased their orbital distances and may have been ejected from its solar system even prior to supernova. Thus the supernova may have shattered but probably did not atomize all its planets.

A supernova creates tremendous shock waves, shattering planets, and expelling most of the star and remaining planetary debris into the surrounding interstellar medium. This debris eventually becomes part of the surrounding nebular ring created by the solar winds, planetary atmospheres, and expelled mass of the dead star (Greaves 2005, van Dishoeck 2006).

There is also a possibility that when a star goes supernova, it ejects molten iron into these nebular clouds. Therefore, planets begin to form when debris comes into contact with and then sticks to the hot iron which becomes a planetary core (Joseph and Schild 2010a). Planetary cores therefore, may be comprised of the remains of the shattered planets which had been expelled from the dead system. Therefore, some solar systems may acquire fully formed or broken and shattered planets which grow by accretion after they are captured by the new protostar.

Given the paucity of evidence for nearby stars the same age as the sun, it could be assumed only a few protostars may have been produced by the supernova of the parent star. Thus, the parent star may have been only a few solar masses larger than the sun. This assumption is supported by isotopic analysis of the Murchison meteorite. Measurments of silicon carbide (Werner et al. 1994; Nittler & Hoppe 2005) and presolar SiC grains (Savina et al. 2003) from the Murchison indicates that the grains and silicon are most likely the residue of or were produced secondary to a supernova of a carbon rich intermediate mass star that was between 1.5 to 3 solar masses (Savina et al. 2003). Thus, the Murchison may be a remnant of the parent star’s solar system, though this can’t be determined at this time.

As only the estimated mass of that star is available and there is no information on nearby stars at the time of supernova, a Hertzsprung-Russell diagram cannot be applied to determine the age of the parent star at the time of supernova. However, based on the estimated ages and lifetimes of other intermediate mass stars (Pillitteri and Favata 2008) it can be estimated that a parent star of between 1.5 and 3 solar masses was at least 1 billion to 3 billion years in age before it entered the red giant phase.

Hues of Light under Alien Suns

I’ve been much outdoors lately, brainstorming my storyline, making notes and traveling. The idea for this post came after I’ve spent the whole day observing daylight and its hues.

If you had ever wondered what colors of light your world has, I might have an easy answer for you. But I think some would want to see the hues for themselves. Well, I do.

Before moving to the main dish I must say this method only works for earth-type atmospheres (unless you know color temperatures for other atmospheres).

Mars-sunset
Mars with its blue sunsets is a good example of the difference the atmosphere makes.

I also assume our observer is human (his/her eyes are adapted to solar spectrum which peaks at 501 nm, green-yellow portion of it) and we have a single star.

The distribution of a wide variety of physical, biological, and man-made phenomena follow a power law, including the sizes of earthquakes, craters on the moon and of solar flares, the foraging pattern of various species, the sizes of activity patterns of neuronal populations, the frequencies of words in most languages, frequencies of family names, the sizes of power outages and wars, and many other quantities. And I’m making this mathematical relationship my instrument of choice as well.

So, what we need to do is simply compare two stars. (Don’t frown; it’s easy, assuming you use a spreadsheet program).

First of all we’ll need the properties of our Sun and the properties of the star in question (for our examples I will use two stars of spectral classes FV and KV, the Sun being the GV star). These properties are effective temperatures in Kelvins and masses relative to solar. That’s it. The mass of the star is arguably its most important property. And I’m using it as the main component in my power law equation to get what I want. And what I want is the color temperature of illumination. What we are going to do is not very scientific, but it works well under our condition of earth-type atmosphere.

The Sun’s effective temperature is 5778 K and its mass is 1. The F star will be 7500 K and 1.4 solar masses. The K star will be 3700 K and 0.45 solar masses.

My next step will be determining the power relations between the Sun and each of the two stars. I’m using MS Excel spreadsheet, so my formulas look approximately like this:

Exp = LOG(7500; (5778*1.4)) = 0.9916 for our F star

Exp = LOG(3700; (5778*0.45)) = 1.0449 for our K star

For other masses and effective temperatures you’ll need a recalc, of course.

Now then, let’s move onto the next part to get the hues of daylight.

Color temperatures

Color Temperature is a measurement in degrees Kelvin that indicates the hue of a specific type of light source. Color temperatures attributed to different types of light are correlated to visible colors matching a black body (e.g. a star), and are not the actual temperature. High color temperatures are considered “cold” and low are considered “warm”.

Color temperature would not be such an important factor in color perception if people were not adaptable. Our eyes will adjust to various light sources which have different color temperatures. And even though the power spectrum density of the light is different, we still see the light as white.

Simply put, color temperature is the tendency of different “white light” sources to change our perception of a color. The color temperature of a light source causes the colors of everything illuminated to change, but the change is often barely noticeable.

Color Temperatures
Color Temperatures

The effect of sunlight on the perceived color of an object changes with temperature because of how much air the sunlight has to pass through. If the sun is directly overhead (warmer), it passes through less air than it does when it is low on the horizon (cooler). Colors in northern climates, especially in the winter, look different than they do in southern climates.

The processes of absorption and scattering in the atmosphere are responsible for the apparent colors of the sun and the sky. While sunlight falls only on non-shadowed areas, the light of the sky falls on everything, so shadow hues are determined by sky color. The hue gradient is clearly noticeable when the sun and the sky obviously differ in color, like near the sunrise and sunset, and the difference in colors of shadowed and illuminated parts becomes the clearest on light surfaces such as snow.

The color temperatures for solar illumination (outdoors) are:

  • Sunlight (sunrise or sunset) – 2000 K – 3000 K
  • Sunlight (1 hour after dawn) – 3500 K
  • Sunlight (early morning and late afternoon) – 4300 K
  • Sunlight (average noon, summer, mid-latitudes) – 5000 – 5400 K
  • Daylight (sunlit sky) 5500 – 6500 K
  • Overcast sky / haze – 6000 K
  • Light summer shade – 7100 K
  • Average summer shade / hazy sky – 8000 K
  • Open shade on clear day – 9000 K
  • Heavily overcast sky – 10000 K
  • Sunless blue skies – 11000 -12000 K
  • Open shade in mountains on a really clear day – 20000 K

In order to get our alien hues, we need to do some simple math again. For our example I will take the color temperature for solar sunrise/sunset, 2000 K. The general formula for our stars will be the following:

TCs=(CTe*Mstar)^Exp

TCs is the color temperature of stellar light in the atmosphere, CTe is the light color temperature from the hue list above, Mstar is the mass of the star relative to solar, and Exp is what we calculated in the previous step.

For our F star the average sunrise/sunset hue will be 2619 K, brighter and sharper than the Sun’s; for our K star this hue will be around 1221 K, dimmer and softer than the candle light. To see these temperatures in color, you might consider this chromaticity (hue and saturation) table.

Also, check out this page of the The Planetary Habitability Laboratory (PHL) >> Sunset of the Habitable Worlds.

Recommended read: The Physics and Chemistry of Color: The Fifteen Causes of Color by Kurt Nassau, 2nd Ed, 2001.

colorph

Have you ever wondered why the sky is blue, or a ruby red? This classic volume studies the physical and chemical origins of color by exploring fifteen separate causes of color and their varied and often subtle occurrences in biology, geology, mineralogy, the atmosphere, technology, and the visual arts. It covers all of the fundamental concepts at work and requires no specialized knowledge.

This is an excellent scientific overview of human perception of color.

The book IS expensive, but if you have access to a good library, it is a good choice.

Stellar Zoo: Meet the Species

This time I’ll focus on stellar classes and some of their most important (and unique) features to help navigate right to your choice. If you are reading this, I assume that you’ve probably looked through some other articles about stellar classes elsewhere (e.g. Wikipedia, Stellar classification) and deliberately search for more detailed info for your future world-to-be. This is exactly what I have in mind, presenting current article on stellar species and their natural habitat.

House of beasts

Our star is a member of a giant cosmic structure known as the Milky Way Galaxy, along with up to 400 billion other stellar folks. It is agreed that the Milky Way is a spiral galaxy, with observations suggesting that it is a barred spiral galaxy. Its stellar disk is approximately 100 000 light-years (30 kiloparsecs, 9*10^17 km) in diameter and is considered to be, on average, about 1 000 ly (0.3 kpc) thick.

The Milky Way is part of the Local Group of galaxies and is one of hundreds of billions galaxies in the observable universe. And that’s a lot of places to reside in, at least in fiction.

So, what is so special about our Galaxy? The answer is simple: we know it has life – us.

Not every galaxy in the universe is suitable for life (as we know it – sorry, I’ll stick with this again since I’m very interested in it being a member of one myself). So, if you are choosing a stellar home from a range of existing galaxies, take a good look at its specs. Galaxies can be distinguished by shapes, sizes, composition and stellar formation activity, and their relationships with neighbors. They are dynamic systems and very violent ones, to that. They live and they die, and they feed on their own kind.

Now, let’s look at the features of our stellar home and how is it suitable for life to exist.

It’s a spiral galaxy with relatively high chemical abundance of interstellar medium, active stellar formation regions and calm places far away from hazardous to life star forming regions.

Two huge bubbles that emit gamma rays have been found billowing from the center of the Milky Way galaxy, extending 25,000 light-years north and south from the galactic core. Gamma rays are the most energetic forms of light, and in space they tend to come from violent events such as supernovae or from extreme objects such as black holes and neutron stars.

These bubbles are made of hot, charged gas that’s releasing the same amount of energy as a hundred thousand exploding stars. Scientists are conducting more analyses to better understand how the structure was formed. One possibility includes a particle jet powered by matter falling toward the supermassive black hole at the galactic center. While there is no evidence the Milky Way’s black hole has such a jet today, it may have in the past. When galactic black holes are actively feeding, they tend to spew jets of particles traveling at nearly the speed of light. Astronomers have found such active galactic nuclei elsewhere in the universe, but have never before seen any convincing proof of this process happening in the Milky Way. The bubbles also may have formed as a result of gas outflows from a burst of star formation, perhaps the one that produced many massive star clusters in the Milky Way’s center several million years ago. If that’s the case, the giants could now be dying together, creating an outbreak of supernovae.

Update Jan 2013: observations tell the bubbles are star-power.

Update Sept 2013: around 2 million years ago, a bright moon-sized smudge was also visible in Earth’s southern sky.

Update August 2014: Despite extensive analysis, Fermi bubbles defy explanation. The mystery remains.

Galaxies are in motion and they crash into one another from every conceivable direction. It is believed that Andromeda and the Milky Way galaxies will collide in just a few billion years. During the collision our Sun and solar system may be stripped away from its present orbital radius and come to reside in Andromeda. If the two galaxies merge they will form an elliptical galaxy.

These images show 6 different snapshots of galaxies at different stages of merging.
These images show 6 different snapshots of galaxies at different stages of merging. Credit: NASA, ESA, the Hubble Heritage Team (STScI/AURA)-ESA/Hubble Collaboration and A. Evans (University of Virginia, Charlottesville/NRAO/Stony Brook University), K. Noll (STScI), and J. Westphal (Caltech)

Galaxies exchange stars. In fact, some of the stars from the Sagittarius Dwarf Elliptical Galaxy (SDEG) may have been captured by the Milky Way billions of years ago (Chou, et al., 2009; Majewski et al., 2003). Moving in a roughly polar orbit around the Milky Way as close as 50,000 ly from its galactic center (Ibata et al., 1997), SDEG comes far too close to the Milky Way for the dwarf to remain intact from the resulting gravitational tides. Here is a dramatic display of galactic cannibalism. Although it may have begun as a ball of stars before falling towards the Milky Way, SDEG is 10,000 times smaller in mass than the Milky Way, so it is getting stretched out, torn apart and gobbled up by our Galaxy. The Canis Major Dwarf Galaxy (CMDG) is even closer (Martin et al., 2004). SDEG and CMDG are both older galaxies and the Milky Way likely stripped millions of stars from them (Chou, et al., 2009; Martin,et al., 2004; Majewski et al., 2003).

Our Galaxy hosts more than a dozen known stellar streams, the remnants of satellite galaxies that were gravitationally torn apart and consumed. Most of the other streams loop around the plane of our disk-shaped galaxy, like octopus tentacles grasping a dinner plate.

The Milky Way has 14 known dwarf galaxies orbiting it, and recent observations have also led astronomers to believe the largest globular cluster in the Milky Way, Omega Centauri, is in fact the core of a dwarf galaxy with a black hole in its center, which was at some time absorbed by the Milky Way.

If colliding, merging, and interacting galaxies and their stars and solar systems harbored life, then not just stars, but living organisms would have also been transferred between galaxies. Therefore, even if life had been fashioned only once, in some ancient galaxy which predates our own, the descendants of this life form could have easily journeyed from planet to planet, from solar system to solar system, and from galaxy to galaxy.

A living planet with an atmosphere, orbiting within the habitable zone of a sun-like star, will be subjected to that star’s solar winds. In the case of Earth, the powerful magnetic field protects the planet from these winds. These winds will periodically increase significantly in strength and eject air-born microbes into space and distribute them not just to neighboring planets, but outside the solar system where they may come to contaminate collections of Oort Cloud stellar objects and passing comets. After hundreds of millions of years survivors may fall upon a planet orbiting a distant star.

However, this does not mean that all this free floating molecular material would have achieved life. It needs the right address and the right time of delivery. Nevertheless, given even the odds of 1 in a trillion, it can be predicted that life could have arisen in multiple galaxies through chance combinations of the necessary ingredients in the nebular clouds.

So, the question is which galaxies are best suited for life formation and evolution?

We may consider galaxies as composed of some “building blocks” whose scale and importance varies from galaxy to galaxy. These include a nucleus, bulge, lens, bar, spheroidal component, disk (with arms, rings, etc), and an unseen halo which is significant for the mass distribution and dynamics. The order revealed by existing classification systems tells us that these are not really independent; disk/bulge correlates overall with arm morphology, for example. These relations hold clues to both the formation and evolution of galaxies, and their suitability for life.

Looking at these classification systems, I can name at least four galactic factors that are vital for our objective: stellar population, chemical abundances in the interstellar medium, star formation history along with integrated stellar spectrum and location of potential life-bearing system in the galaxy.

A spiral galaxy like the Milky Way contains stars, stellar remnants and a diffuse interstellar medium (ISM) of gas and dust. This medium has been chemically enriched by trace amounts of heavier elements that were ejected from stars as they passed beyond the end of their main sequence lifetime. Higher density regions of the interstellar medium form clouds, or diffuse nebulae, where star formation takes place. In irregular galaxies, they may be found throughout the galaxy, but in spirals they are most abundant within the spiral arms. A large spiral galaxy may contain thousands of H II regions.

Together with irregulars, spiral galaxies make up approximately 60% of galaxies in the local Universe. They are mostly found in low-density regions and are rare in the centers of galaxy clusters.

In contrast to spirals, an elliptical galaxy loses the cold component of its interstellar medium within roughly a billion years, which hinders the galaxy from forming diffuse nebulae except through mergers with other galaxies. Gas is the raw building material for stars and the more gas a galaxy contains, the more stars are born.

Most elliptical galaxies are composed of older, low-mass stars, with a sparse interstellar medium. Star formation is minimal or has finished after the initial burst, leaving them to shine with only their aging stars. In general, they appear yellow-red, which is in contrast to the distinct blue tinge of a typical spiral galaxy, a color emanating largely from the young, hot stars in its spiral arms.

Elliptical galaxies are believed to make up approximately 10–15% of galaxies in the local Universe but are not the dominant type of galaxy in the universe overall. They are preferentially found close to the centers of galaxy clusters and are less common in the early Universe.

Despite the prominence of large elliptical and spiral galaxies, most galaxies in the universe appear to be dwarf galaxies. These galaxies are relatively small when compared with other galactic formations, being about one hundredth the size of the Milky Way, containing only a few billion stars. Star formation in dwarf galaxies appears to be complex, with many systems exhibiting multiple episodes of star formation.

Take, for example, the Magellanic Clouds (Large Magellanic Cloud and Small Magellanic Cloud). These dwarfs are members of our Local Group and are orbiting our Galaxy. While both are often considered an irregular type (the NASA Extragalactic Database lists the Hubble sequence type as Irr/SB(s)m), they contain very prominent bars in their centers, suggesting that they may have previously been barred spiral galaxies. Aside from their different structure and lower mass, they differ from our Galaxy in two major ways. First, they are gas-rich; a higher fraction of their mass is hydrogen and helium compared to the Milky Way. They are also more metal-poor than the Milky Way; the youngest stars in the LMC and SMC have a metallicity of 0.5 and 0.25 times solar, respectively. Both are noted for their nebulae and young stellar populations, but as in our own Galaxy their stars range from the very young to the very old, indicating a long stellar formation history.

There are, of course, other morphologies, like ring or lenticular galaxies, for example.

If you have further interest in galaxies, I suggest reading “Galaxy Morphology and Classification” by Sidney van den Bergh.

Stellar populations and their habitat

Stars are the building blocks of galaxies. They are formed continuously in some galaxies, and only in bursts in others. The term stellar population is used to refer to a single generation of stars characterized by a common age and chemical composition. A galaxy can be composed of a large number of individual populations. Stellar populations are not discrete in their properties, but rather have a continuum of characteristics that reflect the changes in star formation with time. Stellar populations are tracers of events in galaxy’s past and formation.

A young (less than 100 Myr) population contains massive stars. These are hot and generate much blue light. An old (more than 3 Gyr) population contains no massive, hot stars, only cool low-mass stars on the main sequence and red giants. It is therefore yellow-red in color. A very young population (less than 10 Myr) produces much ionizing radiation, which creates H II regions in the surrounding gas, whose spectra contain strong emission lines. The dominant emission line of hydrogen gives such regions a characteristic pinkish tint in color images. Thus, the integrated color of a stellar population is a function of its age, and this relation can be used to age-date populations in distant galaxies.

The Hertzsprung-Russell (HR) diagram is the basic tool for analyzing the temperature distributions of evolving stellar systems.

Hertzsprung-Russell diagram

In the HR diagram temperature (increasing to the left) is plotted against instrinsic stellar brightness or luminosity (increasing upward). Most stars fall on the main sequence (MS), which runs diagonally across the HRD. More massive stars on the MS are brighter and hotter, hence bluer. MS stars maintain themselves by burning hydrogen in their cores. But when they run out of H fuel, they evolve off the MS (to the right, or toward lower temperatures, in the diagram). More massive stars evolve faster. A single generation will have stars with a large range in mass, which means that its HR diagram will change as the more massive stars evolve.

You may also enjoy playing with the following HR Diagram Explorer.

There are basically three stellar populations in our Galaxy, corresponding to the three distinct dynamical components to the Galaxy; the disk population, the bulge population and the halo population. The disk population inhabits the rotating, flattened region of our Galaxy. The bulge population is restricted to the rounded, central region of the Galaxy, also rotating. And the halo population inhabits the far outer regions of the Galaxy, on long ellipisodal orbits that takes it into the disk and bulge.

The three components not only have distinct kinematic properties, but the types of objects in them also varied. The disk contains all the gas and young stars, although old stars are also found there. The bulge is dominated by old stars and a violent core. The halo contains very old stars and globular clusters. The reason for this separation of stellar types is a clue to how the Galaxy formed.

Disk and bulge stars tend to be rich in heavy elements (above helium on the periodic table). Halo stars tend to be very poor in heavy elements. Changes in the chemical composition of a star are due to the initial chemical composition of the gas cloud that it was born from. This heavy elements are mostly produced by supernova explosions, gas clouds become enriched by the ejecta of supernova. The larger the number of supernova near a cloud, the richer in heavy elements it will become. As time passes, each of the gas clouds in the Galaxy will increase in the abundance of elements such as carbon, iron, etc. So the more recent a star has been formed, the richer in heavy elements it is. This is a form of dating system for stars and we deduce that halo stars are the oldest stars in the Galaxy since they have the lowest chemical abundances. The disk stars are the youngest since they are the most metal rich.

Distribution of star populations in Milky Way

Thin disk (Population I)

The thin disk of the Milky Way has sustained ongoing star formation for ~10^10 years. Consequently it contains stars with a wide range of ages, and the thin disk may be divided into a series of sub-populations of increasing age.

The spiral-arm population is the youngest in the disk; it appears to trace the spiral pattern of the Milky Way. This population is concentrated very close to the disk plane, with a scale height of ~100 pc. Representative objects include H I and molecular clouds, H II regions, protostars, stars of types O & B, supergiants and classical cepheids. The metallicity of this population is somewhat higher than that of the Sun. As the young stars age, they drift out of the spiral pattern.

The disk population is more smoothly distributed and does not seem to trace the spiral structure. This population may be further subdivided into young, intermediate, and older categories, with ages of ~1, ~5, and ~10 billion years, respectively. The characteristic scale-height of this population increases with age, ranging from ~200 to ~700 pc, while the metallicity declines to perhaps ~20% of the solar value. Representative objects include stars of type A and later, planetary nebulae, and white dwarfs. Our Sun is a member of this group.

Population I stars have regular elliptical orbits around the galactic centre, with a low relative velocity. The high metallicity of Population I stars makes them more likely to possess planetary systems than the other two populations, since planets, particularly terrestrial planets, are thought to be formed by the accretion of metals.

Stellar halo (Population II)

The stellar halo of the Milky Way includes the system of globular clusters, metal-poor high-velocity stars in the solar neighborhood, and metal-rich dwarf stars seen toward the galactic center. While star formation in the outer halo largely ceased more than 10^10 years ago, the situation in the inner kpc of the galaxy is not so clear.

Globular clusters are the classic tracers of the galactic halo. The metal-poor clusters have a nearly-spherical distribution extending to many times the Sun’s distance from the galactic center, while the metal-rich clusters are concentrated towards the center of the galaxy and may have a more flattened distribution.

Metal-poor subdwarfs in the solar neighborhood have large velocities with respect to the Sun and other disk stars. These stars are on highly eccentric orbits about the galactic center; the net rotation of this population is amounts to less than ~40 km/sec, while their random motions are quite large. The metallicity of these stars ranges from ~0.1 to ~10% of solar.

Metal-rich subdwarfs in the central bulge of the galaxy span a wide range of metallicity, from ~0.1 to > 100% of solar. The inner kpc of the bulge also appears to contain stars of type A, implying that some star formation has occurred rather recently.

Thick disk (Intermediate Population II)

Intermediate Population II stars are common in the bulge near the center of our Galaxy; star-counts suggest that this intermediate population is distributed in a thickened disk with a scale height of ~1 to 1.5 kpc. This population accounts for only ~1% of the stars in the vicinity of the sun but dominates the high-altitude tail of the thin disk population at z > 1 kpc.

Kinematic studies imply that the thick disk rotates with a velocity of ~180 km/s, compared to the less than 40 km/s rotation of the metal-poor subdwarfs. This would indicate that the thick disk is more closely associated with the thin disk population, which rotates at ~220 km/s. Metallicity measurements also support the idea that the thick disk is distinct from the stellar halo; the characteristic metal abundance of thick disk stars is ~25% of solar, while the stellar halo is significantly more metal-poor in the solar neighborhood.

If you decide to go further into gory details of galactic kinematics, you should check Astrophysical Formulae, Volume II: Space, Time, Matter and Cosmology, K. R. Lang, 3rd ed., pp 42-47.

Also, you could check this site or this one for rotation curve of the Galaxy.

Taxonomy of dragons

The vast majority of stars are main sequence stars – these are star like the Sun that are burning hydrogen into helium to produce their energy. Most stars spend 90% of their life as main sequence stars.

The spectral types and subclasses represent a temperature sequence, from hotter O stars to cooler M stars, and from hotter subclass 0 to cooler subclass 9. The temperature defines the star’s “color” and surface brightness. The luminosity class designation describes the size (gravitational acceleration in photosphere) of a star from the atmospheric pressure. For larger stars of a given spectral type, the surface gravity decreases relative to what it was on the main sequence, and this decreases the equivalent widths of the absorption lines.

There are several classes of luminosity: 0 – Hypergiants (extremely luminous), Ia – Bright Supergiant Stars (large and luminous), Ib – Supergiants (less luminous than Ia*), II – Bright Giants, III – Giants, IV – Subgiants, V – Main Sequence, sd – Sub-Dwarfs, D -White Dwarfs. *Classes can be categorized like: Ia, Ib, Ic, IIa, IIb, IIc, and so on (sub-a being brighter that sub-b).

The classification of stars
The classification of stars. Credit: Richard Powell

Stars are clearly distinguished according their spectra: O type stars are the brightest and the live the shortest; B type stars are blue white and also burn bright, but not as bright as the O type; A type stars are less bright, a little larger than our Sun, but still a lot hotter; F – Brighter than our Sun and a little hotter; G – Our Sun is a G type star; K – dimmer that our Sun, with longer lifespan because temperature is lower; M – the dimmest stars, will burn for a long time. Each spectral type is divided into 10 subclasses, A0, A1, A2, …A9 etc.

Spectrum features for each class according to element radiation lines must be considered. O stars – strong HeII (He+) lines, in absorption or emission; strong UV continuum; weak HeI, prominent H lines; SiIV, OIII, NIII, CIII. B stars – strong HeI in absorption; HII absent; H lines stronger; MgII, SiII. A stars – H lines at max in A0; HeI & HeII absent; FeII, SiII, MgII at max; some CaII; weak neutral metals. F stars – H lines weaker; CaII H&K stronger; neutral metals stronger. G stars – CaII lines dominate; H very weak; FeI, MnI, CaI become stronger; CH G-band strong. K stars – neutral metals strong; TiO bands appear. M stars – neutral metals and molecules (CH, TiO, etc.)

Element Lines in the Spectra of Stars
Chem Element Lines in the Spectra of Stars

The complete spectral type (e.g., F5V) nearly uniquely places a star in the HR diagram. Classification schemes assume solar abundances and slight changes are needed for metal-poor stars.

Many stars have peculiar features, their spectral types are coded with additional designations.

To explore each stellar class in greater detail, you can look through this data.

Luminosity and temperature are not the only important properties of stars and I will be returning to this theme some time later, in context of habitable worlds.

P.S. I’ve avoided the term Galactic Habitable Zone on purpose for several reasons. One of them being a thought that in galaxies similar to our own, stars such as the Sun can migrate great distances, thus challenging the notion that parts of these galaxies are more conducive to supporting life than other areas. It’s the same as saying some parts of a well built road are better for traffic than others. Accidents happen, just not with everyone during the ride. Also, some circumstances may result in suitable planets outside the defined “habitable zone”. And there’s always the probability of life as we don’t know it.

Set Your Timer: The Star

Stars are amazing. Lots of things depend on them. So, figuratively speaking, they are your local centers of the universe.

A star is a massive, luminous, self-gravitating ball of plasma. And the force that triggers a stellar timer is gravity. So, once it is on, things start to happen. During its lifetime a star undergoes a sequence of changes. These changes affect everything in the vicinity of a star; and maybe a little further than that. Stellar evolution is studied by observing numerous stars at the various points of their life, and by simulating stellar structure with computer models.

Before choosing a star (or a multiple star) for your system, you might consider some options here: life as we know it; life as we don’t know it, or no life at all. And if the latter, what next? Will there be someone arriving or is it just a dead world?

In this article I will stick to the life as we know it scenario.

This leaves me with a limited choice of suitable stellar types from the main sequence range between a late F and an early/mid K. Because these are the ones that are more or less suitable having an earthlike world (be it a planet or a moon) in terms of habitability according to the UV constrains and other accepted criteria of habitability (liquid water on planet’s surface, comparable surface inventories of carbon dioxide, water, dinitrogen and other biogenic elements, an early history allowing chemical evolution that leads to life, and subsequent climatic stability for several billions of years).

Stars earlier than F0 have very short (2 Gyr) main sequence lifetimes and, hence, have a low probability of harboring planets with complex life. Their habitable zones migrate outwards rapidly, so even microbial life might not have time to develop in these systems. Planets orbiting stars later than K5 are likely to become tidally locked, which may be a problem for habitability. Or maybe not, but it is a different case, though no less interesting.

Main sequence stars of spectral class F8V to K2V (or 0.50 to 1.00 in B−V) are similar to the Sun in mass and evolutionary state, and are usually called solar-like stars.

Circumstellar habitable zones

The habitable zones of main sequence stars have traditionally been defined as the range of orbits that intercept the appropriate amount of stellar flux to permit surface water on a planet. The inner HZ boundary is determined by the loss of water via photolysis and hydrogen escape. The outer HZ boundary is determined by the condensation of carbon dioxide crystals out of the atmosphere.

However, in the case of life as we know it, this is not the only factor to consider.

Ultraviolet radiation is known to inhibit photosynthesis, induce DNA destruction and cause damage to a wide variety of proteins and lipids. In particular, UV radiation between 200-300 nm becomes energetically very damaging to most of the terrestrial biological systems. On the other hand, UV radiation is usually one of the most important energy sources on the primitive Earth for the synthesis of many biochemical compounds and, therefore, essential for several biogenesis processes (Buccino et al. 2006, 2007).

Chromospheric UV radiation is increased in young stars in regard to all stellar spectral types. Compelling observational evidence (Gudel et al. 1997) shows that zero-age main sequence (ZAMS) solar-type stars rotate over 10 times faster than today’s Sun. As a consequence of this, young solar-type stars, including the young Sun, have vigorous magnetic dynamos and correspondingly strong high energy emissions.

Flare activity (an important agent for the delivery of highly energetic radiation, especially UVC) is most pronounced in K and M-type stars, which also has the potential of stripping the planetary atmospheres of close-in planets, including planets located in the stellar habitable zone. The amount of chromospheric radiation is, in a statistical sense, directly coupled to the stellar age as well as the presence of significant stellar magnetic fields and dynamo activity.

Studies have shown that chromospherically induced biological damage for planets hosted by F and G-type stars will be insignificant. The situation is, however, decisively different for K and M dwarfs. Any of these stars, including inactive stars, show noticeable chromospheric emission. For stars with basal chromospheric emission, chromosphere induced biological damage only occurs for stars of spectral type mid-K and later, whereas for stars with relatively high chromospheric emission, chromosphere-induced biological damage can also be found in the environments of very late G-type and early K-type stars (Cuntz et al., 2010).

However, photochemical/radiative–convective modeling shows that planets around K2V and F2V stars both exhibit better UV protection than does Earth. See “Ozone concentrations and ultraviolet fluxes on Earth-Like planets around other stars”, Segura et al, Astrobiology, Volume 3, Number 4, 2003.

So, in order to set your world in a right place of your solar system, you need to consider two factors – liquid water HZ and UV HZ.

Both are important factors to determine the location and the size of circumstellar habitable zone.

For life systems to evolve, the planet should be in the habitable zone continuously during a certain time. A common choice for this time is 4 Gyr, the time that was needed on Earth for intelligent life to emerge and evolve into a technological civilization. Henry et al. (1995) and Turnbull and Tarter (2003a) considered 3 Gyr, while Schopf (1993) used the time required for microbial life to emerge 1 Gyr in his definition of the CHZ.

Because main sequence stars become brighter as they age and convert hydrogen into helium and heavier elements, habitable zones tend to migrate outward with time. In order to analyze the evolution of the habitable zones, it is assumed that the UV radiation follows the same pattern as the change in luminosities of F, G and K main sequence stars.

Until an atmospheric protection is built, a planetary surface would be exposed to larger amounts of UV radiation, which could act as one of the main source in the synthesis of bioproducts and, in a certain wavelength, could be damaging for DNA. Both concepts represent the UV boundaries for the UV habzone. To obtain the exact AUs of this “safe circle”, you might consider using formulas for UV habitable zones around host stars presented by Guo et al, 2010.

For traditional luminosity-water habitable zone calculations see Kasting et al.,1993.

An example of liquid water and UV HZs calc

The traditional and the UV HZ must at least partially overlap for a considerable amount of time in order to host a habitable planet in it.

An example of HZ calculus output in MS Excel

Things you’ll need to get started

As I mentioned before, stars evolve. You need evolutionary tracks of the star if you are interested in the long term evolutionary path of your world and its inhabitants, whatever those might be.

First of all, decide on a mass and effective temperature of your star. Those usually correspond to the spectral class (F8V…K2V or later). You might actually want to use an existing star from a catalogue to get all the parameters necessary. And don’t forget to look up star’s actual age. It will be your anchor.

In order to obtain evolutionary tracks of any star you might choose, you don’t have to derive any formulas. It has already been done. You simply can use stellar model grids. Personally, I like to use Stellar models grids I. Z=0.02, M=0.8 to 125 Msol by Claret, 2004, which present stellar models suitable for the mean solar neighborhood, i.e. for Z=0.02 (metallicity) and X=0.70 (hydrogen). The covered mass range is from 0.8 up to 125Msol and the models are followed until the exhaustion of carbon in the core, for the more massive ones. In addition, the effective temperatures of the more massive models are corrected for the effects of stellar winds, while models with lower effective temperatures are computed using a special treatment of the equation of state. You can read a more detailed description here and see the grids here.

The grid model has time steps in years and you can compare it with your selected star’s data (i.e. in luminosity, effective temperature and other things according to age, which is your anchor).

Try to experiment with different grids for other element abundance ratios. They can be found here. (E.g. Grids of stellar models. VIII. From 0.4 to 1.0 Msun at Z=0.020 and Z=0.001, Charbonnel+ 1999, description).

When you’re done, you’ll have a full table of stellar lifetime parameters, which later can be used as a basis for all of your calculations. These include mass, luminosity, effective temperature, central density and temperature, element abundancies and some other stuff like fractional gyration radius at several age steps.

Have fun, and more exciting stuff to follow.